I was recently reading an article on Data Science Central by Vincent Granville about the categories of Data Scientists and I started pondering how I fit into the various categories. As categorization goes it wasn’t easy to choose just one, or two, or three for my own experience. There were elucidated 8 major categories of data scientists, which I have briefly summarized below. There are, of course, many ways to categorize experience and techniques and this is not some absolute categorization – but in general I do agree with these as 8 currently applicable categories of Data Scientists that pretty much cover the major experience needs for most medium/large businesses.
- Pure Mathematics – cryptography, navigation, physics (and other physical sciences), economics, etc.
- Statistics – statistical theory, modeling, experimental design, clustering, testing, confidence intervals, etc.
- Machine Learning – computer science algorithms and computational complexity, machine learning algorithms, etc. Data
- Engineering – strength in data systems optimizations and architectures, hadoop, data flow and plumbing, etc.
- Spatial Data – GIS, mapping, graphing, geometry, and graph databases.
- Software Engineering – code development, programming languages, software delivery architectures, etc.
- Visualization – data visualization types, solutions, workflows, etc.
- Business – decision science, rule optimization, ROIs, metric selection and definitions, etc.
No matter how much effort I put into trying to summarize these categories either more broadly or more narrowly I found it was hard to visualize them mapping onto people. When I thought of myself or my colleagues, where does each person fit among these categories. So of course, I turned to visualization for help…
But what visualization should be used for something like this? How does one visualize vague categories as they relate to people.. and what is even that data for this?
This is not an insignificant or easily answered question. I read a few other articles, including one that tried to rank/order the experience of famous data scientists (here) and decided that a data table was definitely not going to help the situation. But I did get an idea of where I wanted to start with the data itself: let’s say we setup five levels of experience for each category and assign a skill level in each category as a rating system. The below table is my self-rating:
Now that I have some data to look at, what visualization should be used to start exploring it? The skill level is ordinal, and the categories are nominal. There are no real “numbers” put to this table, although I could think about assigning the columns numeric values (hold that thought). Scatterplots are ineffective at this kind of data, and bar charts are boring and likely wouldn’t add value. I had a hunch and some prior experience that pointed to the idea of a radar chart being a good fit.
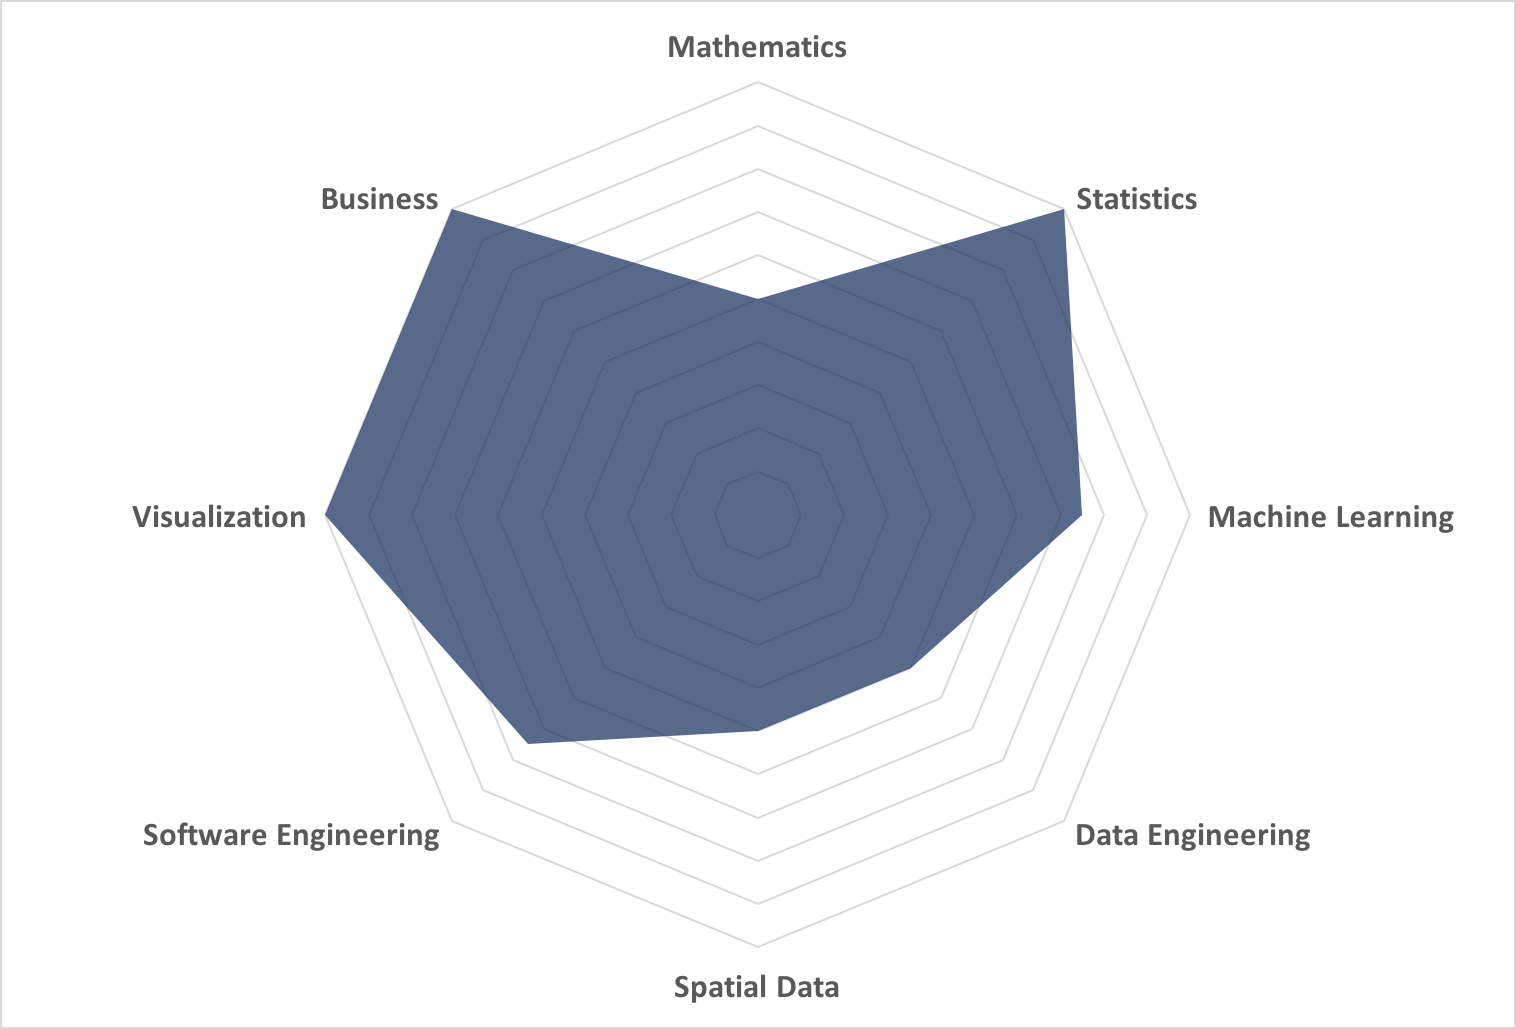
If you are wondering what a radar chart is there is a great reference here. It’s an often misused, misread, and misunderstood chart type – but it can be powerful. What I wanted to get at was a map, or shape, of data science experience for a single person (me in this case). Using a radar chart requires that I assign a numeric value to the categories so I used values of 0, 0.25, 0.5, 0.75, and 1 for the experience rankings and came up with the below chart representing the “shape” in a visual form of my self-categorization of data science experience.

I’m glad you asked. Here is where this visualization provides unique insight. Why create a shape like this? I would create a shape to make comparisons of disparate data sources, in this case people. I used to work on a small, tight-knit data science team. I created mappings of each of their experience along with a data analyst who worked with us and charted the entire team of 4 people on 1 radar chart:

Now things are getting interesting. You can see that this team has certain strengths and weaknesses in the spectrum of data science categories. This might be design, and the ideal data science team makeup is left for another post. However, this is a real representation of a team. Let’s say my team was looking to take on a new project that was outside of the scope of our current expertise: we could now take a chart like this to management and tell them – no, show them – the gap in expertise and why we needed need to hire someone. In fact, we could even do an initial evaluation of candidates using this simple method as a refreshingly straightforward and simple way to pick which people to actually interview!
We started with a vague set of data – our ranking of experience level in loosely-defined categories of data scientists. By visualizing this data there is now an additional dimension of understandability and usability to this categorization of data scientists; we can now compare team members, visualize teams, and see relative gaps and strengths in experience. We have turned very ill-defined information into a useful and powerful tool using visualization.
